
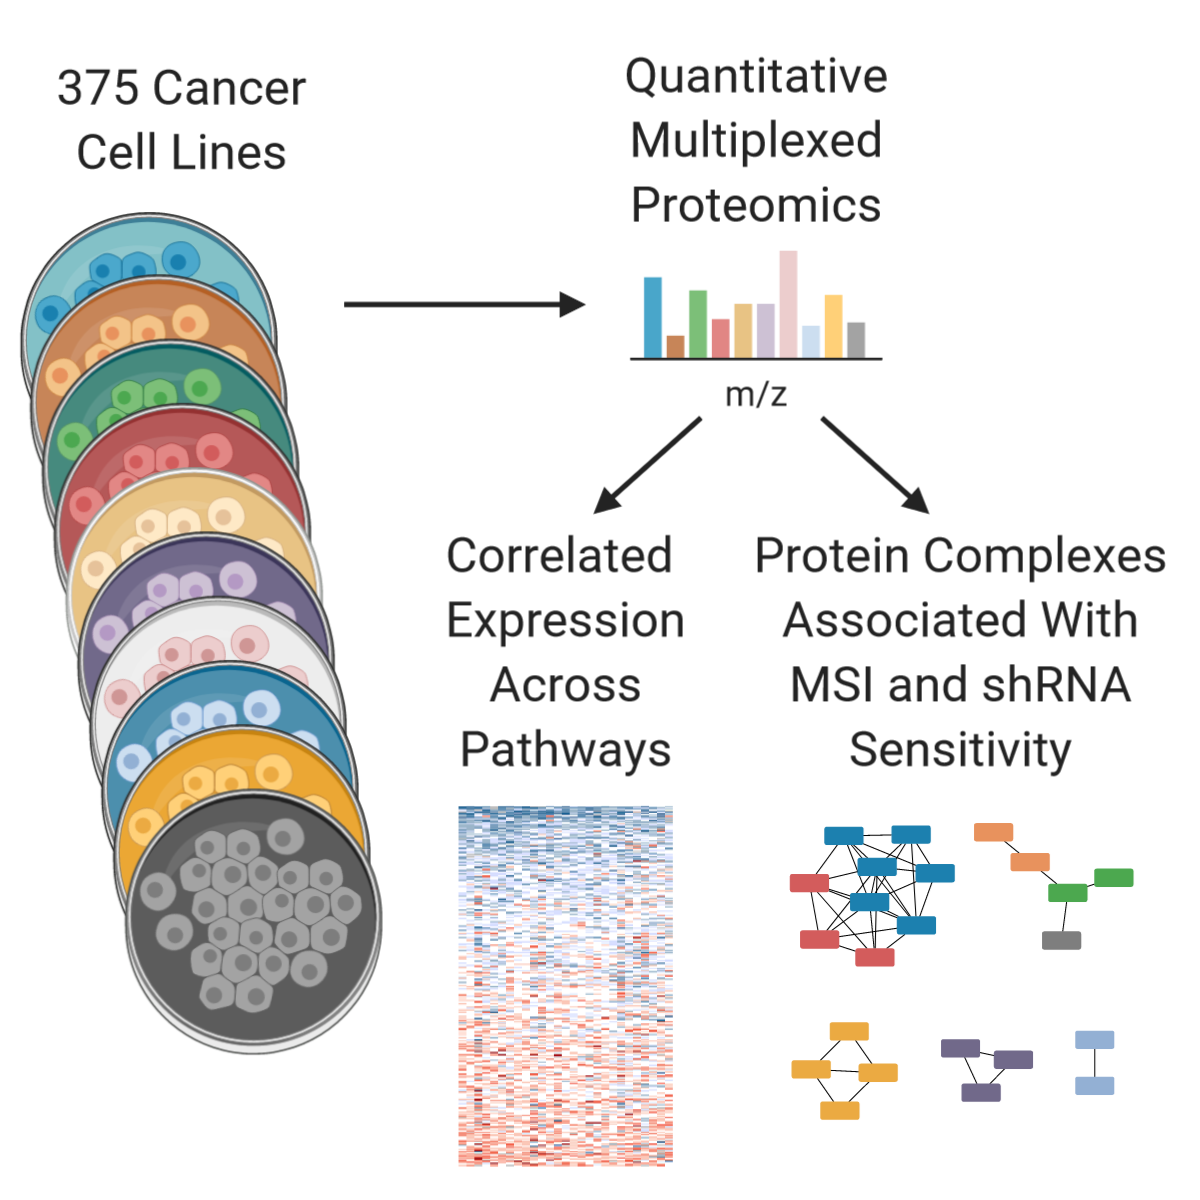
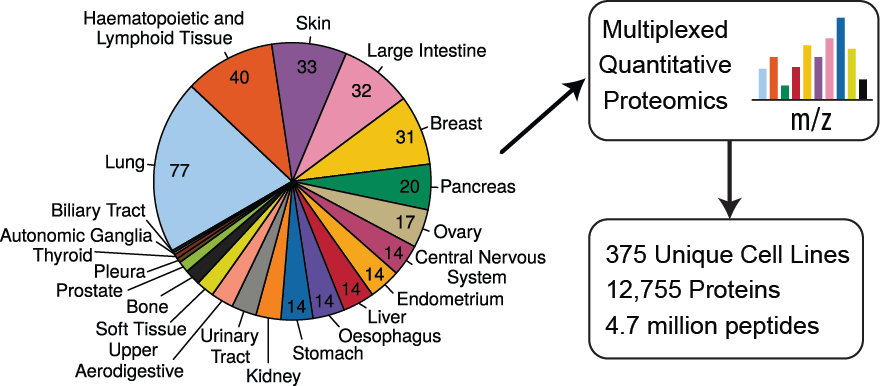
In this publication we expand the Cancer Cell Line Encyclopedia to include quantitative proteome profiling by mass spectrometry of 375 cell lines from diverse lineages. The experiment was performed in multiplex format with 9 biological samples per plex and one common sample to normalize between plexes.
We quantify an average of over 9,000 proteins per experiment across 42 multiplex experiments consisting of 504 runs on the mass spectrometer and over 1,500 hours of instrument time. Additionally, the first two multiplexed experiments were performed in biological triplicate, the results of which are included here.
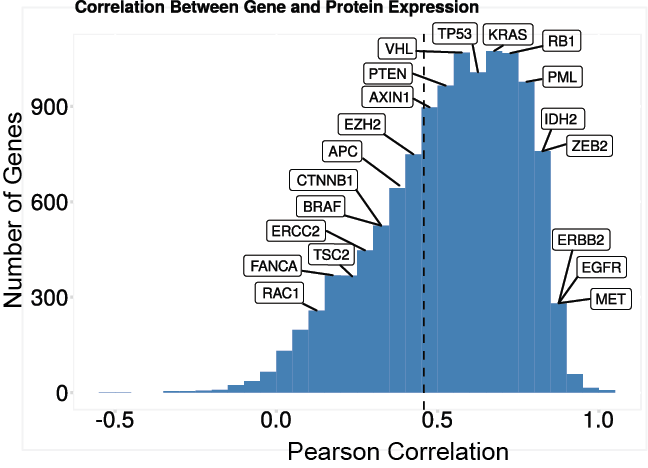
The average per-protein correlation between the proteomics data and RNASeq data was ~ 0.5. Gene sets with a higher than average RNA/protein correlation tended to be localized to the plasma membrane or the extracellular matrix while those with lower than average correlation included many notable protein complexes.
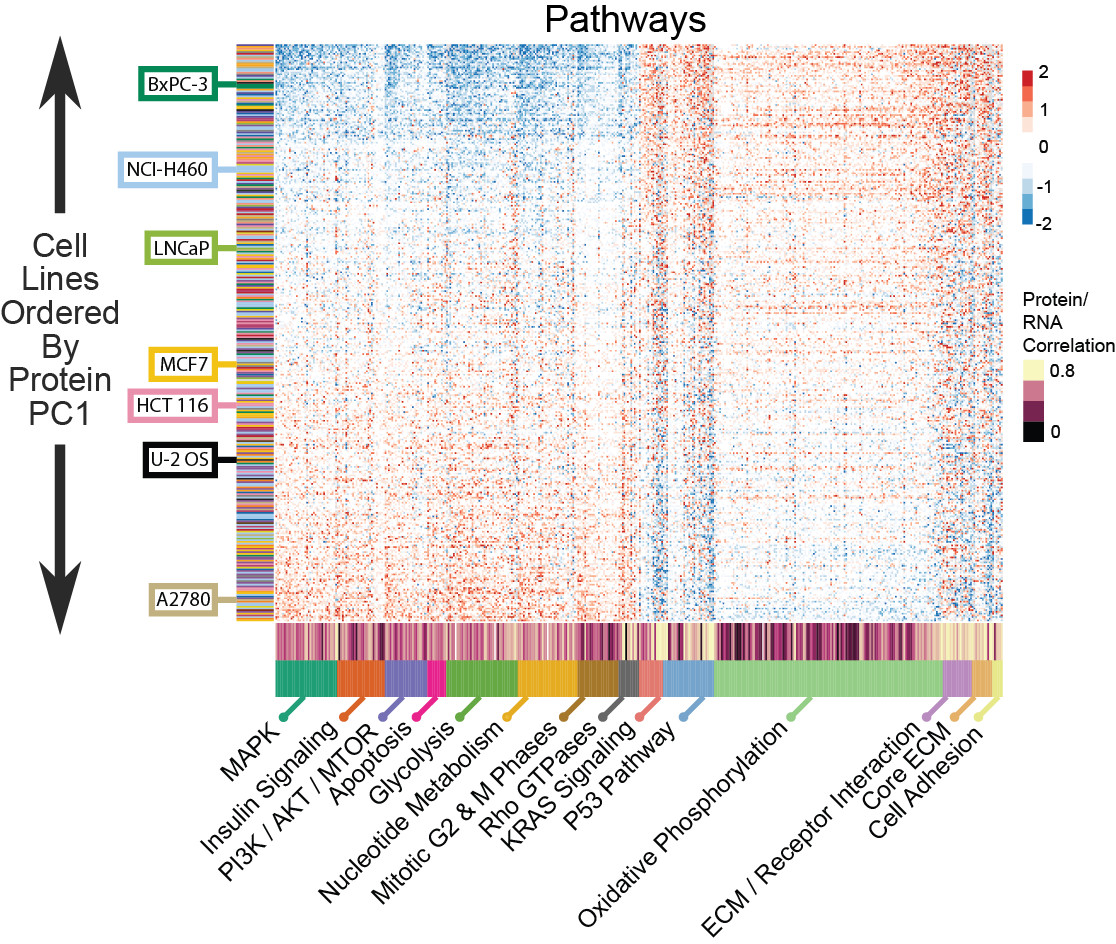
We observed a significant difference between haematopoetic and lymphoid lineages and cell lines derived from other solid organ lineages. Taken together, the non-haematopoetic and lymphoid linages showed a striking alignment of multiple pathway members and GO categories across sets, indicating a broad organization of the proteome independent of the solid organ lineage. This included correlated expression between proteins with high protein/RNA correlation, such as cell adhesion molecules, with proteins with average or low protein/RNA correlation, such as the OxPhos pathway.
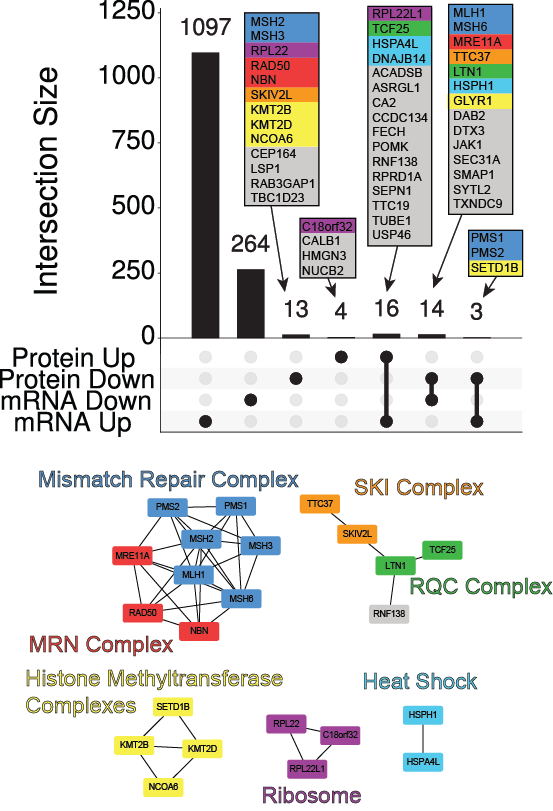
Cancer is a disease fundamentally linked to mutation, and in some cancers the total amount of mutation is one to three orders of magnitude higher than in most tumors. To better understand the effects of hypermutation on the proteome, we assessed the effect of the dominant form of hypermutation in the CCLE, microsatellite instability (MSI), on protein expression. We unexpectedly found the levels of multiple protein complexes associated with MSI. Some complexes, such as the mismatch repair pathway, have well understood roles in this form of cancer. However, we also found altered regulation of Histone Methylation proteins as well as members of the SKI complex and the RQC complex, which are involved in quality control monitoring at the ribosome.
While the histone methylation proteins appear to be associated with MSI, the SKI and RQC proteins appear to be associated with total mutation burden. The only gene that is mutated in cancers that was consistently associated with these alterations was RPL22, which appears to also be associated with mutation burden rather than MSI itself. In line with the downregulation of histone methyltransferases, we observe bulk downregulation of H3K4me1 and H3K4me2 in MSI cells.
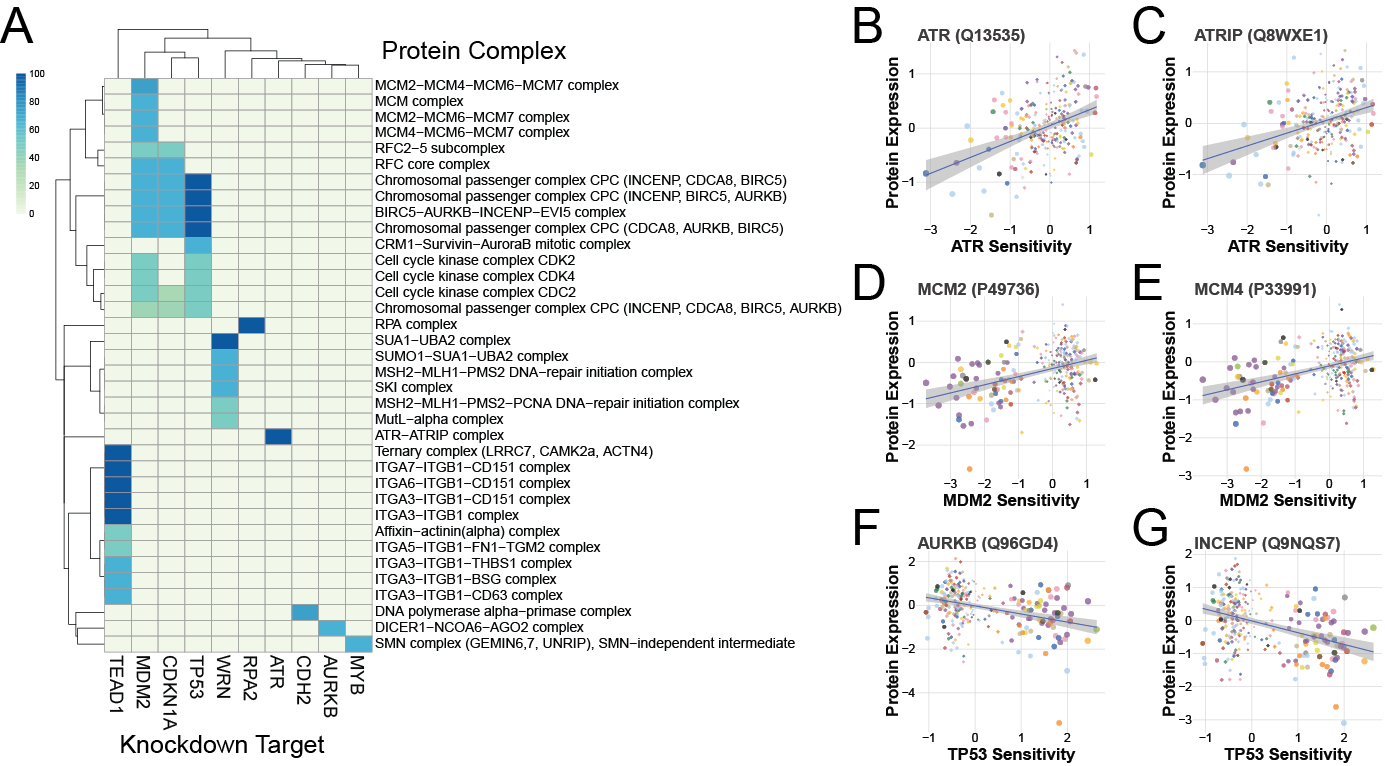
Finally, inspired by the MSI results, we looked for protein complexes that showed altered expression based on sensitivity to shRNA treatment or gene mutation. Several complexes were associated with these sensitivities and mutations, including the MSI-related ones from before.
We have also published a supplemental manuscript that acts as a guide to the dataset. This manuscript addresses two groups of users: analysts who want to use the data to ask biological questions and computational proteomics workers who want to understand how and why the data normalized in detail. For the biological analyst, questions like how to interpret the quantitative values, how to manage the duplicated cell lines, and ideas on handling missing values are discussed. For the details of the normalization, alternative approaches and the various diagnostics we used to arrive at the normalized data are described.
All of the normalized data are provided as supplemental tables with the manuscript at Cell. Additionally, we provide them here as spreadsheets.
The raw files have all been uploaded to the MassIVE repository at UCSD.
For researchers who want something in between the raw files and the final normalized spreadsheet we have constructed a database dump that can be imported in to a relational database (i.e. PostgreSQL) for querying. This database is being distributed in a system named Globus that Harvard Medical School has to provide access to large data sets. To gain access please email Ed Huttlin or David Nusinow .